3rd Year NRG4Cast Prototype
NRG4Cast Prototype is available at https://energia.sistemapiemonte.it/nrg4cast/login/start.do
The NRG4CAST prototype gives user a possibility to monitor and analyse historical, real-time and predicted “energy related” data coming related to NRG4CAST objects, consumption centres, nodes and sensors, metadata, and data related to external features. The NRG4CAST prototype GUI presents all the possible options and functions at a single click, and highlights the most important ones. GUI has a user-friendly interface, shows error messages and provides as flexible as possible data visualisation solution.
NRG4CAST system analyses 6 different pilots from four countries. The main focus is district heating, energy consumption in public buildings and University Campus, public lighting and charging stations for electrical vehicles. Moreover, we’ve implemented a virtual consumption centre configuration functionality in order to support the integrated city scenario which combines energy consumption data from sensors belonging to different isolated pilots.
The front end web application of the NRG4CAST project uses the Central Authentication Service (CAS), a single sign-on protocol for the web. It allows user to access a multiple applications providing user id and password just once. Once authenticated by any of the NRG4CAST Toolkit components, the user will have access to other system components secured with this permission. If login is successful, the user will be automatically redirected to the NRG4CAST welcome page. All the applications associated to this certain user id, role id and task id are listed under the “Available applications” menu ( Figure 1).

Figure 1. NRG4CAST Toolkit welcome page, available applications for the “super user” profile
Based on the roles, the web application allows or doesn’t allow certain functions. In particular, basic and advanced users and associated roles have been created for each pilot. Basic user (guest) provides users with the rights necessary to operate all the GUI functions except for an Advanced Search (Figure 2). Furthermore, Advanced user (manager) has an access for all the basic and advanced GUI functionalities including Advanced Search and SQL query tool. Both base and advanced users are allowed to operate only within the pilot of competence.

Figure 2. Report Management & Visualization and Real time Visualization GUI, basic user fir-guest (all the GUI functions except for the Advanced Search and SQL query tool
The prototype front page is designed as a dashboard. The top boxes are referred to the whole pilot and represent current and predicted measurements such as actual and predicted energy consumption, carbon footprint, temperature, cloud cover and humidity.
At the left side of the prototype there is a map with a zoom on the area of interest (chosen pilot site). All the geo-referenced objects are shown on the map (Figure 3). By clicking on the object, the user visualises all the information related to the object and sensors installed (metadata, location, selected sensors last measurements).

Figure 3. Georeferenced objects visualised on the map, NTUA pilot example
Each pilot contains a set of predefined reports on actual and predicted energy consumption and possible savings in kW/h. These reports provide visual representation of energy consumption trend within a certain timeframe. Once report diagram appears at the screen, there is a possibility to compare energy consumption, energy usage and thermal energy production with a number of parameters such as temperature, pressure, humidity, wind speed, wind direction, cloud cover, precipitation, visibility, people presence at the building, circulation of vehicles etc. Moreover user can visualize multiple data series (by unchecking Sync Graph Timeline) and compare them to each other. It’s possible to export reports in tabular format.
Furthermore, an advanced search option is available for an expert user. There is a possibility for hierarchical search (Figure 4) where user navigates trough the project data structure and selects consumption centres, nodes and sensors to be visualised on the graph and analysed. All the chosen data can be exported in tabular format.

Figure 4. Hierarchical search tool, NTUA pilot example, objects visualisation
Additional advanced search option is an SQL query (Figure 5). For example, the NRG4CAST monitoring database can be queried regarding summed consumption for all the objects, which are part of a certain consumption centre.
The central data repository integrating all the data residing in the NRG4CAST Toolkit is the Monitoring database. The Monitoring database is queried by the Monitoring component either in the case of pre-defined reports or in the case of the creation of on-the-fly complex SQL queries which can yield very useful results. For example, the total consumption of all the objects in a consumption centre or in a pilot may be calculated and presented on a time series through the appropriate SQL command.

Figure 5. Advanced search SQL query tool, direct connection with the NRG4CAST monitoring database
A number of APIs and services were implemented in order to connect NRG4CAST components. Besides, the connection to the external systems developed by partner such as Rule Editor, Sensor register and Root Cause Analysis Component is effectuated via http link within the NRG4CAST web application.
The real time alerting is now available within the NRG4CAST web application (Figure 6). The NRG4CAST alarms were classified as follows:
• technical alerts (broken sensors, no data etc.)
• economic alerts
• environmental alerts
• energy alerts.
Moreover, an alarm level concept has been introduced to classify alerts as a notice, warning, or alarm. Each alert is referred to a certain object. All the alerts are geo-referenced and are visualised on the map in real time (Figure 7).

Figure 6. Visualisation of alerts in real time, Turin pilot

Figure 7. Georeferenced alerts in real time, NTUA pilot example
It is possible to view the system historical alerts within the left corner of the GUI (Figure 8).

Figure 8. NRG4CAST Toolkit, Turin Pilot, visualisation of historical alerts
In addition, NRG4CAST team has implemented situational awareness services for a number of project pilots and use-case scenarios. This component is based on the user context and provides related information about the environment to be used in the reasoning process. The NRG4CAST Toolkit utilizes general domain knowledge in order to produce explanations with regard to the results of the reasoning process. Further, personalized rules and user input constitute the basis for the NRG4CAST Toolkit situational awareness services.
In particular, the NRG4CAST situational awareness services have been designed on the baseline of the monitoring and alerting services. The situation is assessed by the NRG4CAST Toolkit through the utilization of sensor information about the environment. The assessment process entails the comparison of an individual user context with the environmental sensory information. Sensory data are inputted to the model which interprets them with regard to an individual user context. The future state of the environment is then anticipated by the model.
The situational awareness services are built on top of the monitoring and alerting services and are closely connected to basic real-time decision support and reasoning environment of the project. The situational awareness GUI allows for anomaly awareness, shows “monetary” savings, and highlights high energy consumption and anomalously high temperatures (Figure 9). It is possible to analyse the energy consumption of an overall complex consumption centre, such as an University Campus, a city, and a municipality area. The situational awareness GUI has been integrated within the NRG4CAST web application GUI.

Figure 9. NRG4CAST Situational Awareness GUI, high temperatures alert
2nd Year NRG4Cast Prototype
The 2nd year NRG4Cast prototype gives user a possibility to monitor and analyse historical and real-time “energy related” data coming from different sensors. The 2nd year NRG4Cast prototype GUI presents various possible options and functions at a single click, and highlights the most important ones. GUI has a user-friendly interface, shows error messages and provides as flexible as possible data visualisation functionalities.
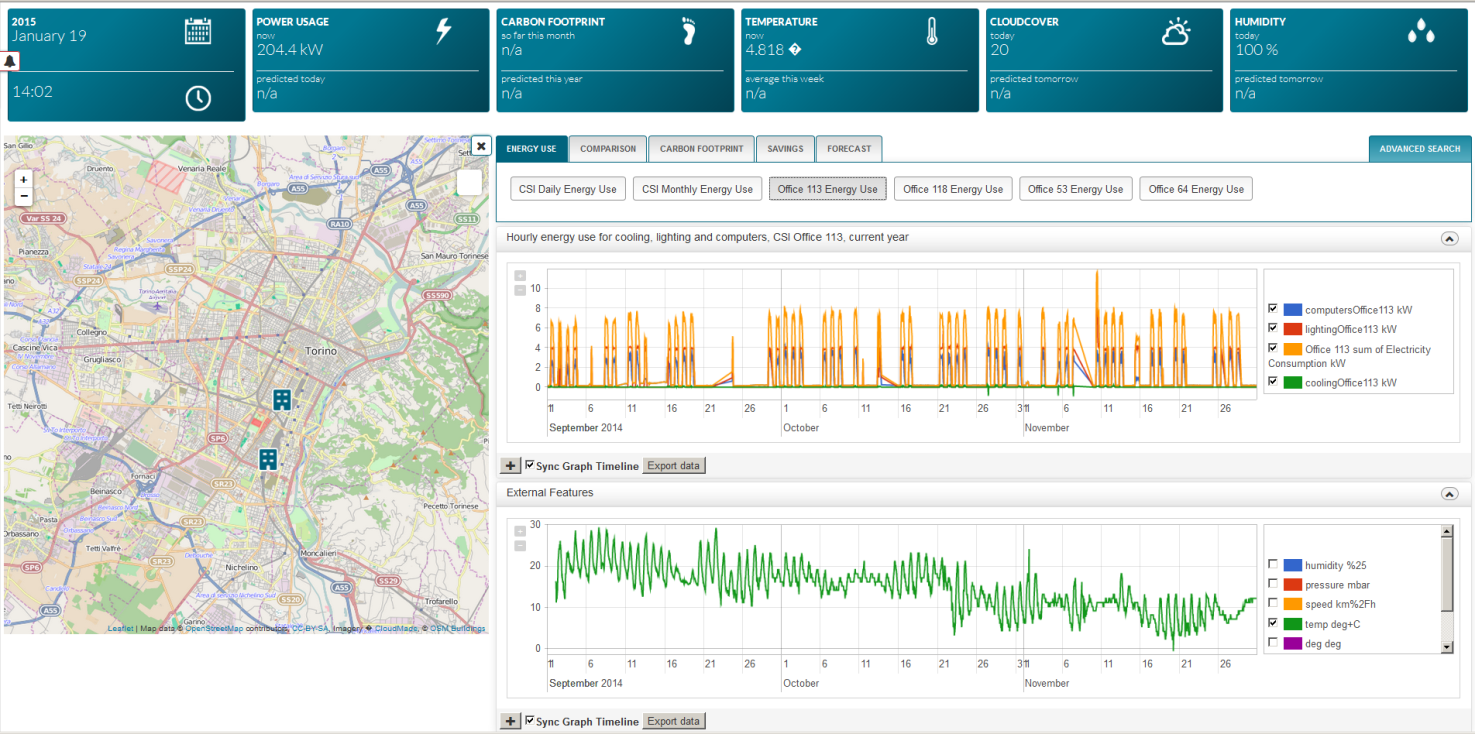
The prototype front page is designed as a dashboard. The top boxes are referred to the whole pilot and represent current and predicted measurements such as actual and predicted current day energy consumption (Power Usage panel); actual and predicted tomorrow temperature, cloud cover and humidity.
At the left side of the prototype there is a map with a zoom on the area of interest (chosen pilot site). All the geo-referenced consumption centres and nodes are shown on the map. By clicking the node, the user visualises all the information related to the node and sensors installed (metadata, location, selected sensors last measurements).
Each pilot contains a set of predefined reports on energy consumption, possible savings in kW/h and forecast. These reports provide visual representation of energy consumption trend within a certain timeframe. Once a report diagram appears at the screen, there is a possibility to compare energy consumption, energy usage and thermal energy production with a number of parameters such as temperature, pressure, humidity, wind speed, wind direction, cloud cover, precipitation, visibility, people presence at the building etc. Moreover user can visualize multiple data series (by unchecking Sync Graph Timeline) and compare them to each other. It’s possible to export reports in tabular format.
For example the “Energy Use” set of reports for Turin pilot includes the report on CSI energy use for the last 3 years, CSI monthly energy use and energy consumption of the 4 typical CSI offices.
Using a set of reports “Saving”, user can evaluate possible savings related to various retrofit actions. For example in the case of Turin pilot, there is a possibility to evaluate savings due to switching off 50% of computers over the night (from 6:00 p.m. till 8:00 a.m.) and/or replacing 100% of existing lighting bulbs with LED (consumption reduced from 100 W to 13 W). On the same graph user can visualise actual consumption and consumption “upon the retrofit action”. The percentage of savings is show as a separate button.
Have a look at the 2nd year prototype video below: